


- Majority Black
- Majority Latine
- Majority Asian
- Majority White
- No Majority Racial Group
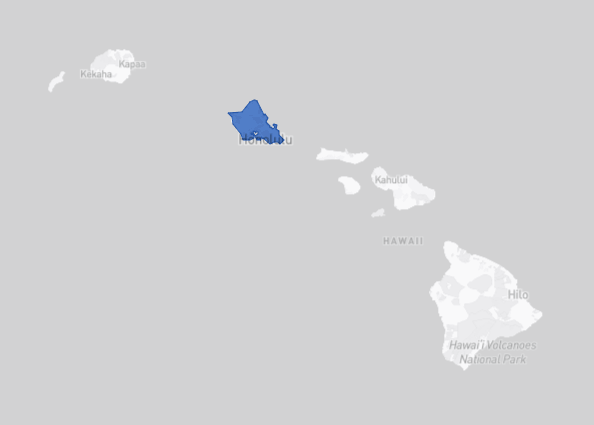
Residential Data Residential data is sourced from 2018-2022 American Community Survey five-year estimates. Under-resourced communities are areas of low income and high poverty, as defined by ICIC. See ICIC report The New Face of Under-Resourced Communities to learn more.
| Majority Race/Ethnicity | |
| Median Household Income | |
| Poverty Rate | |
| Under-resourced |
Business Data Business data is sourced from 2023 Data Axle data. Entries with three or fewer businesses are suppressed to protect business owner privacy.
Data for all industries is reported below.
| Median Revenue | |
| # of Businesses by Size | |
| All employees | |
| 1-9 employees | |
| 10-19 employees | |
| 20-49 employees | |
| 50-99 employees | |
| 100+ employees | |
| Unknown employees | |
Metro
Percent of businesses in each revenue category by race/ethnicity of business owner
This chart shows the percentages of businesses owned by Black, Latine, Asian, Other POC, and White business owners that fall in the revenue ranges specified by our data provider, Data Axle. Other POC including Indigenous, Native Hawaiian and Pacific Islander, and Middle Eastern and North African business owners, were combined due to a small sample size.
Data Axle uses a machine learning algorithm that codes business owners’ race based on their first and last names. Major racial categories are verified by phone survey. We use Data Axle’s 2023 bucketed revenue estimates.
- Black
- Latine
- Asian
- White
- Other
- Unknown
Metro
Percent of census tracts whose median business revenue falls in each revenue category by neighborhood majority racial group
This chart describes the percentage of census tracts by majority racial group whose median business revenue falls in each revenue category. Census tract median business revenue represents the median of all businesses’ revenues in a census tract.
We display these percentage estimates for neighborhoods with majority Black, Latine, Asian, Other/No Majority, and White residents, calculated using 2018-2022 American Community Survey five-year estimates. We use 2023 bucketed revenue estimates from business data provider Data Axle.
- Black
- Latine
- Asian
- White
- No Majority
Metro
Percent of census tracts whose median business revenue falls in each revenue category by under-resourced status
This chart describes the percentages of under-resourced and non under-resourced census tracts whose median business revenue fall in each revenue range. Census tract median business revenue represents the median of all businesses’ revenues in a census tract.
For more information about the ICIC under-resourced community definition, refer to the ICIC report The New Face of Under-Resourced Communities. We use 2023 bucketed revenue estimates from business data provider Data Axle.
- Not under-resourced
- Under-resourced
State
State Average Weekly Wage by Business Size This chart describes average weekly wage by business size (number of employees) for all major industries. We use data from the first quarter of 2023 from the Bureau of Labor Statistics Quarterly Census of Employment and Wages.